Christine McGlade
Could you briefly explain what Data Visualization is and why it is so important, particularly at a time of AI-generated data analysis?
Data visualization is the practice of making (quantitative) data understandable through visual forms such as charts, maps, and diagrams. It helps us see patterns, relationships, and differences that can be difficult to recognize in a spreadsheet. It helps us to understand numbers that are simply too large for us to adequately comprehend as well! As a human-centred designer, I am interested in how those representations help people ask better questions and make informed decisions
AI makes it easier to produce analysis and generate charts, but we still need to critically examine what they show, and especially to ask where did the data come from? Whose experiences are represented, and whose are missing? Does the visualization support the conclusion being drawn? A polished chart can make a weak claim look authoritative. Understanding data visualization gives us the skills to question what we are seeing and communicate responsibly ourselves.
It is also worth mentioning that AI tends to show us only what can be gleaned from what has already been done. As designers, and information designers, our unique human capability is to come up with ideas, interpretations, and innovations that are completely new. If we outsource analysis and synthesis to AI, what we produce will be mediocre at best.
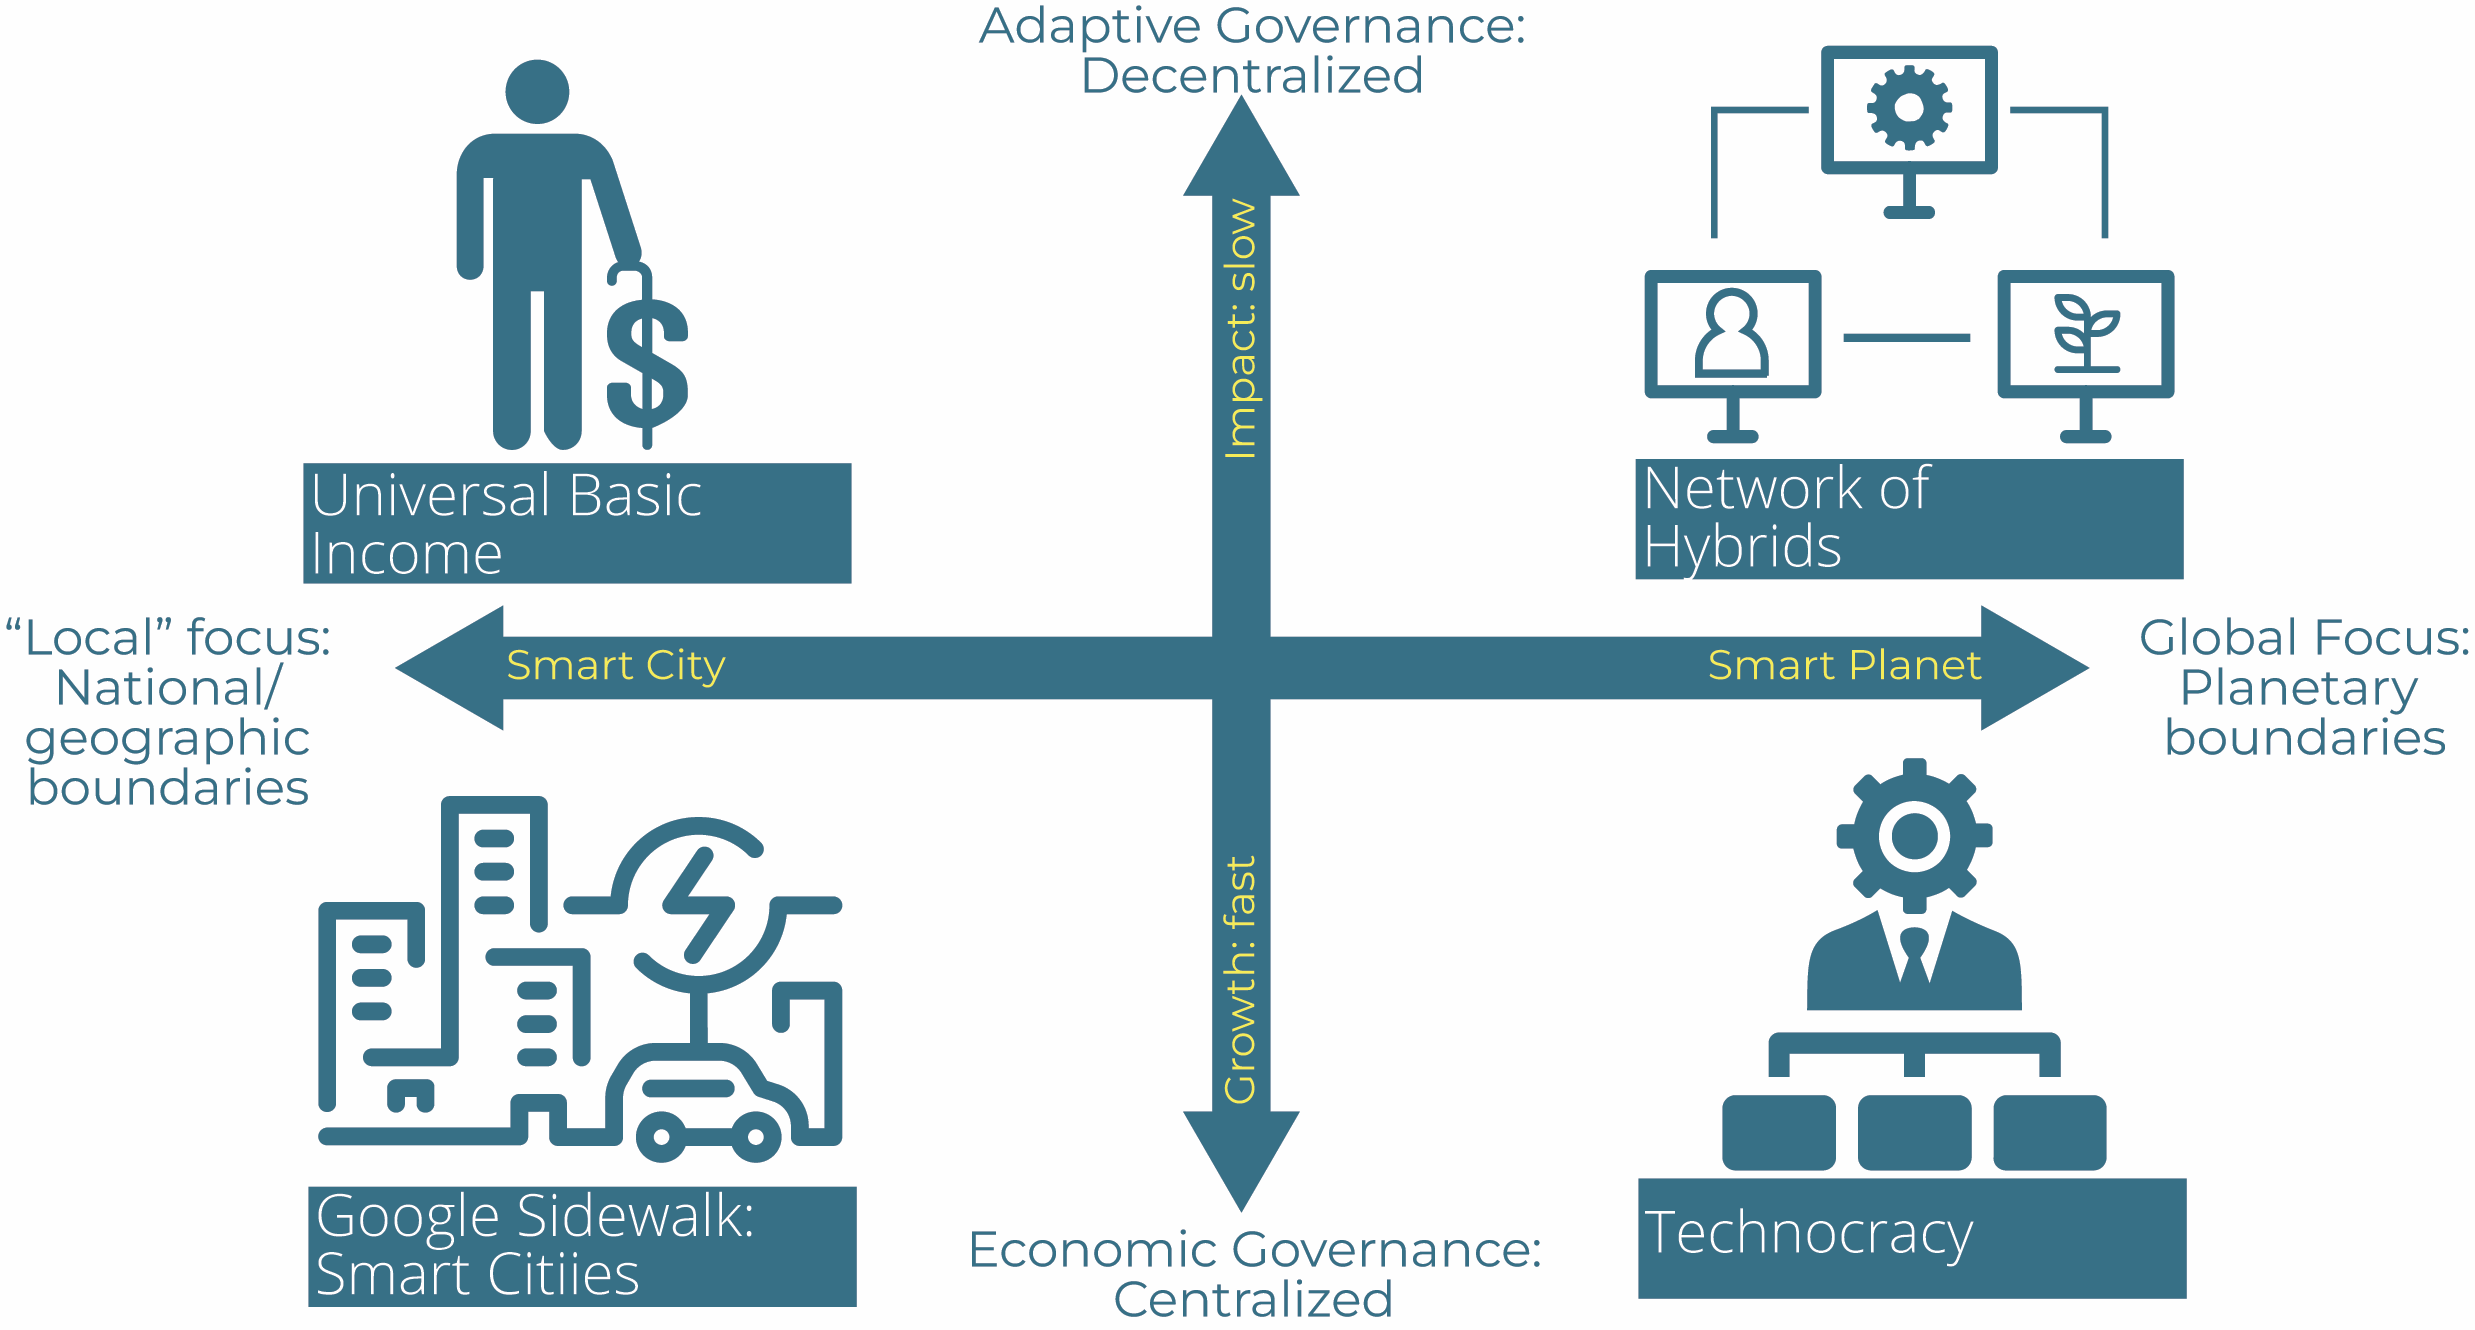
This is a figure from my upcoming publication that represents Four Scenarios for the Future of AI, 2025 © Christine McGlade
What kinds of skills do you teach in the Introduction to Data Visualization course?
I approach data visualization as a design process. We begin with the people who will use the information: what do they need to understand, and what questions are they trying to answer? From there, we explore how to organize data, choose appropriate visual forms, and use colour, typography, hierarchy, and layout to make information clear and accessible.
Students learn to recognize misleading representations and make thoughtful choices about scales, labels, comparisons, and context. I also bring a systems perspective: a number rarely tells us much in isolation. We need to understand the relationships and circumstances around it. The goal is to develop both practical communication skills and the judgment to explain why a particular visual approach works.
Finally: as humans, we respond to narrative: I'm always looking to help students illuminate what story the data is telling us, helping them to turn data into information, yes, but to extract knowledge and even wisdom from what might otherwise be impermeable numbers.
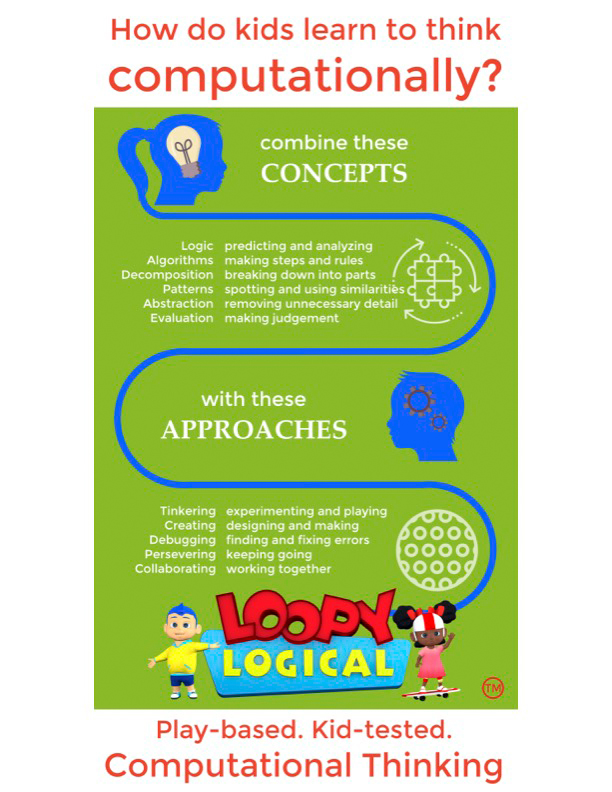
Loopy Logical Infographic Is a piece marketing for a project, 2019 © Christine McGlade and Steve Diguer
Who is this course for and how would it benefit a student at OCAD U SCS?
This course is for people who need to make information understandable to others—whether they work in design, communications, business, research, healthcare, government or charitable/community organizations. You might be presenting research findings, explaining an issue to the public, or helping a team make sense of its work.
You don’t need to think of yourself as a “data person” to become curious about data. The course offers a way to build confidence in interpreting visual information and communicating your own findings. For designers, it extends familiar visual communication skills into working with quantitative evidence. For people coming from other fields, it offers a design approach to making complex information more approachable and useful.
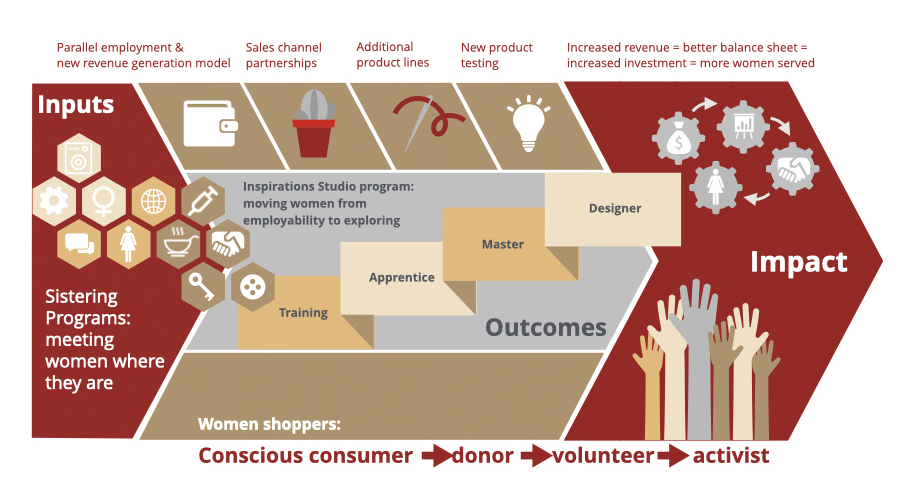
Theory of change diagram An output from a feasibility study, 2018 © Christine McGlade and Calla Lee
In your experience as a digital media professional and educator, what makes a good display and presentation of data analysis and visualization?
A good visualization begins with a clear purpose and respect for its audience. People should be able to understand what they are looking at, why it matters, and where the information comes from. Visual choices should make relationships easier to see, and the presentation should be honest about uncertainty and limitations.
I also ask what happens after someone sees it. Can they ask a more informed question? Understand a situation differently? Make a decision? My work in human-centred and service design has taught me to consider how information will actually be used. A successful visualization gives people a useful way into complexity while preserving the context they need to understand it.
What are some upcoming projects you are working on or looking forward to developing?
"Three Horizons and the Future of Artificial Intelligence (AI): A Seven-Year Retrospective on Scenarios and Systems Change". A chapter in the upcoming SpringerNatureOpen Accessbook titled "The Three Horizons Approach", editors Trace Gale, Andrew Curry, Sue Robinson, Sahar Hadidimoud.
Abstract:
This chapter revisits and updates the foresight research originally presented in Three Horizons of AI: Towards a Theory of Change Model for Machine Learning (McGlade, 2018), which employed the Three Horizons framework developed by Tony Hodgson and colleagues as a lens to examine the ethical and societal implications of machine learning, as the then-primary form of artificial intelligence (AI), within complex socio-technical systems. The original study positioned AI development across three overlapping temporal “horizons,” mapping the tensions between entrenched economic systems (Horizon 1), transitional innovations (Horizon 2), and emerging equitable and human-centered futures (Horizon 3).
In this update, McGlade reflects on the continued relevance of the Three Horizons method, exploring in case-study format how it functioned as a systems-thinking framework and as a foresight method. The chapter will also engage in a renewed analysis of recent developments in AI, notably advancements in generative models, ethical governance frameworks, and the accelerating regulatory landscape, providing a refreshed perspective on the systemic interactions across horizons. Emphasizing both ongoing technological disruptions and evolving societal responses, the paper extends the original foresight work by illustrating how newer trends might align with previously articulated Horizon 2 innovations and Horizon 3 visions of decentralized, ethical, and human-centered AI.
Finally, the chapter explicitly addresses educational applications of the Three Horizons framework, detailing how McGlade has implemented Hodgson’s model as a practical backcasting tool in futures-thinking higher education classrooms with a focus on emerging technologies. By guiding students in mapping complex socio-technical changes backwards from desired (or dystopic) future scenarios, this pedagogical approach effectively bridges theoretical foresight and actionable strategy formulation.